
How Loveable Lifted Conversion by 28.5% and Cut Apparel Returns by 18%
Loveable sells personalized gifts and apparel worldwide. As the apparel range grew, so did sizing hesitation — long product-page sessions, repeat "does this fit?" tickets, and wrong-size returns. Here is what changed in three months.
- Store
- loveable.us
- Industry
- Personalized gifts & apparel
- Market
- United States

Figures reported by Loveable, measured over 3 months.
About Loveable
Loveable is a U.S.-based Shopify store known for personalized gifts — matching couple shirts, anniversary presents, acrylic plaques, wooden signs, and more. Their motto is "Every gift tells a story," and with thousands of customizable products they have built a loyal base of customers who value personalization.
Growth brought a new problem. As Loveable expanded into apparel — T-shirts, hoodies, shoes — one pattern kept showing up in the data: sizing hesitation.
The challenge: sizing questions were slowing down checkout
Loveable's products were well received, but analytics showed friction underneath the surface:
- Shoppers spent a long time on product pages before checking out.
- Support tickets asking "Does this fit true to size?" kept increasing.
- Size-related returns were becoming a recurring cost.
Broken down, the symptoms were consistent:
- Cart abandonment — shoppers added products, then left before completing the purchase.
- Return rate — apparel items came back at a rate nearly 20% higher than non-sized products.
- Support load — the team spent hours every week answering the same sizing questions.
The brand inspired trust; the product pages did not answer the fit question. Loveable needed something scalable and on-brand that would not slow the site down or require a developer.
What Loveable set up in MP Size Chart
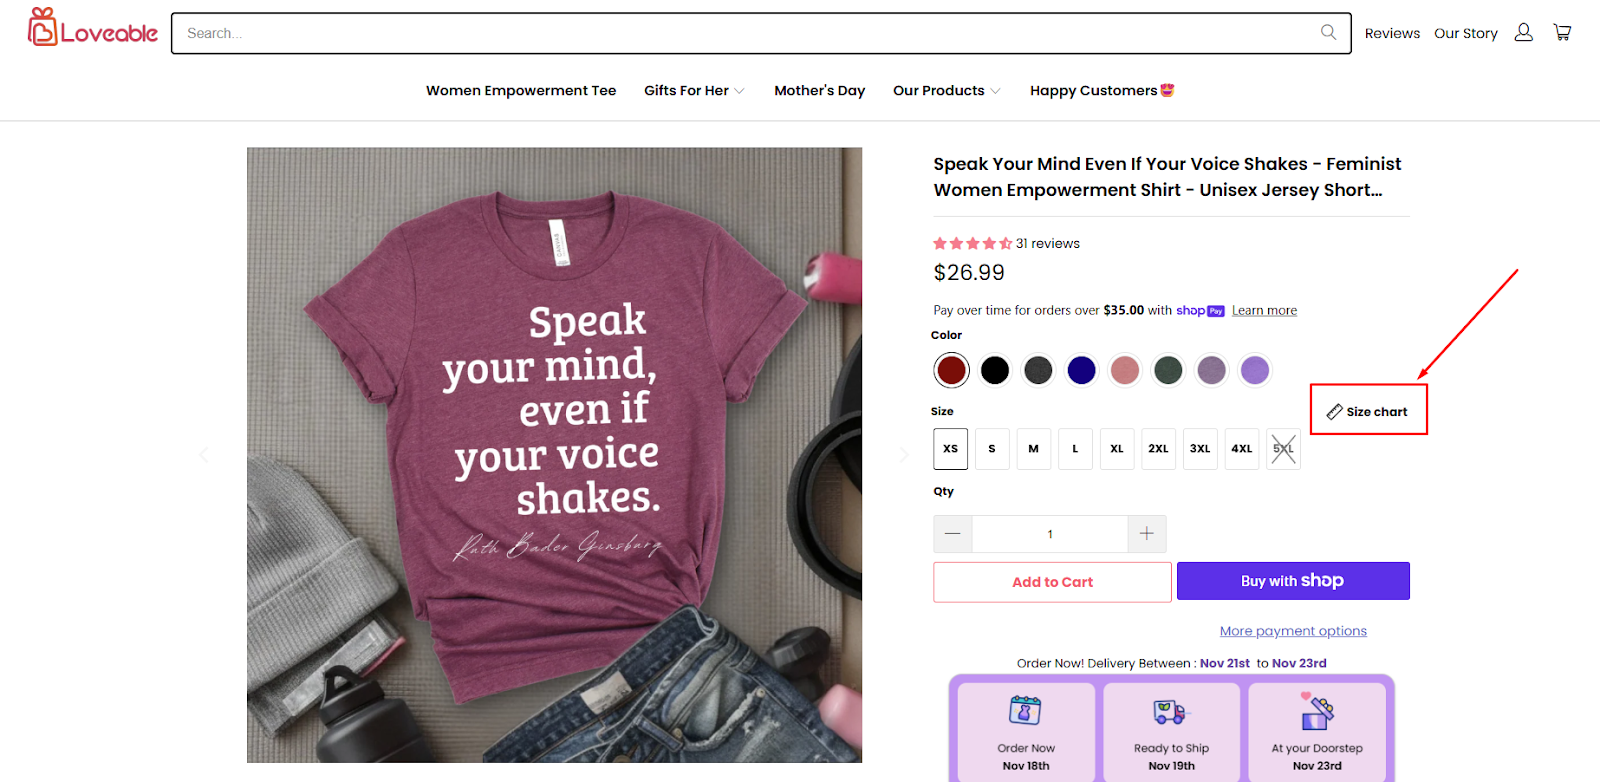
After testing several size chart apps, Loveable chose MP Size Chart & Size Guide. Six features did the work.
1. A separate chart for every product type
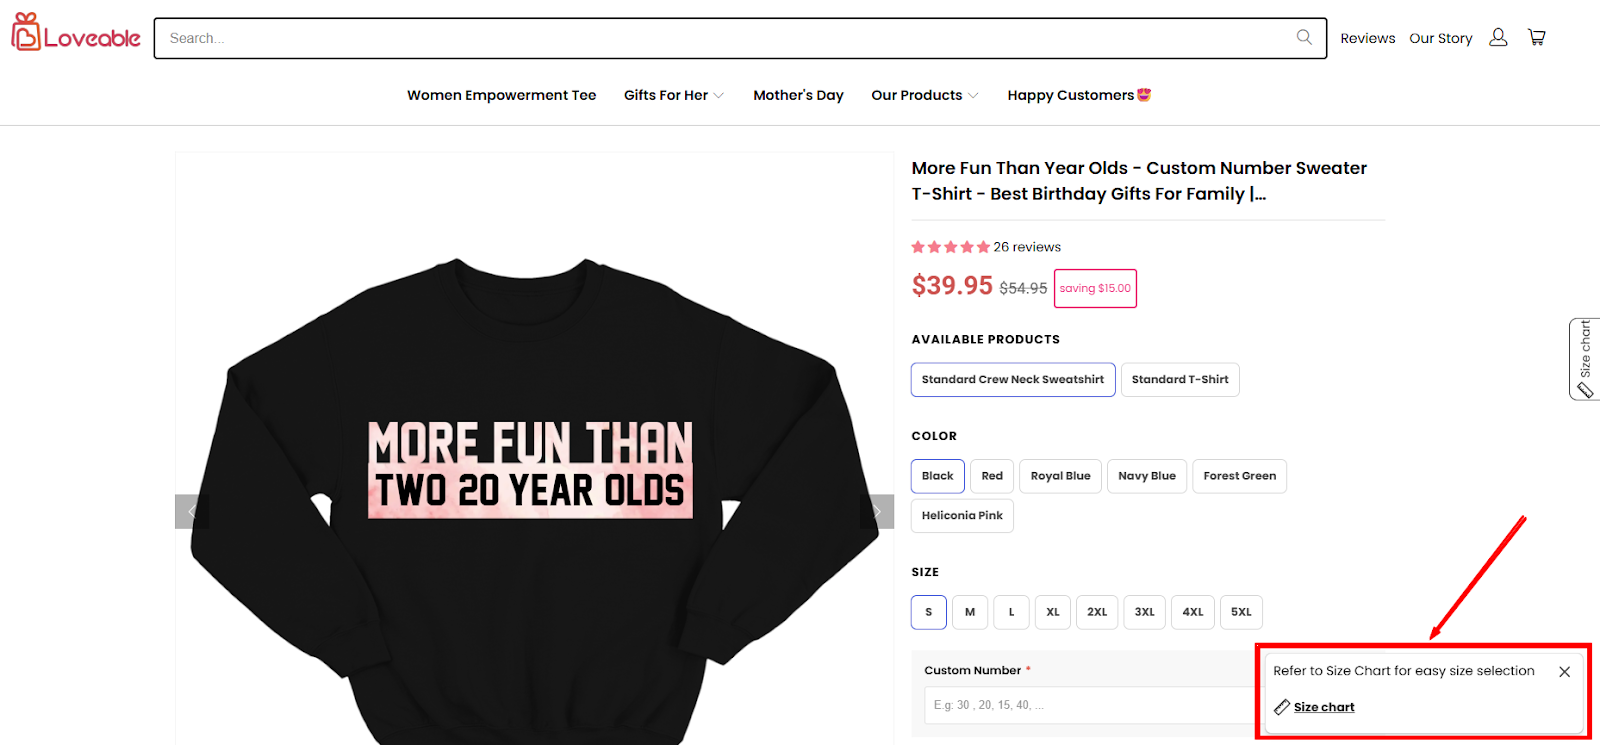
A hoodie does not measure like a women's crop top. Loveable built a distinct chart per product type, each with its own measurement rules, custom images, and measuring instructions — then chose how the chart appears on the page (button, link, or icon).
2. Charts that look like the storefront
Rather than a generic table, the team matched button styles, table headers, background colors, and font sizes to their own UI, and placed the chart right next to the size selector. Shoppers read it as part of Loveable's page, not as a third-party widget.

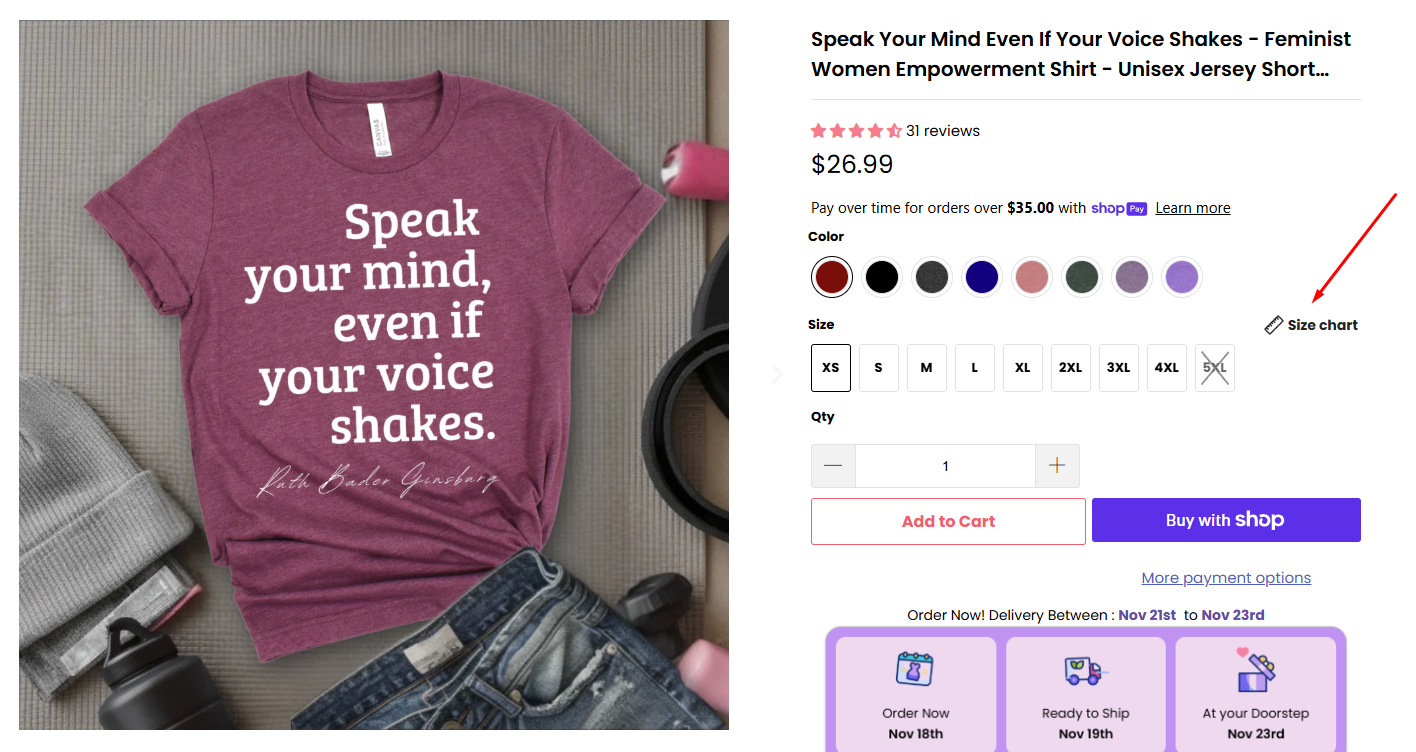
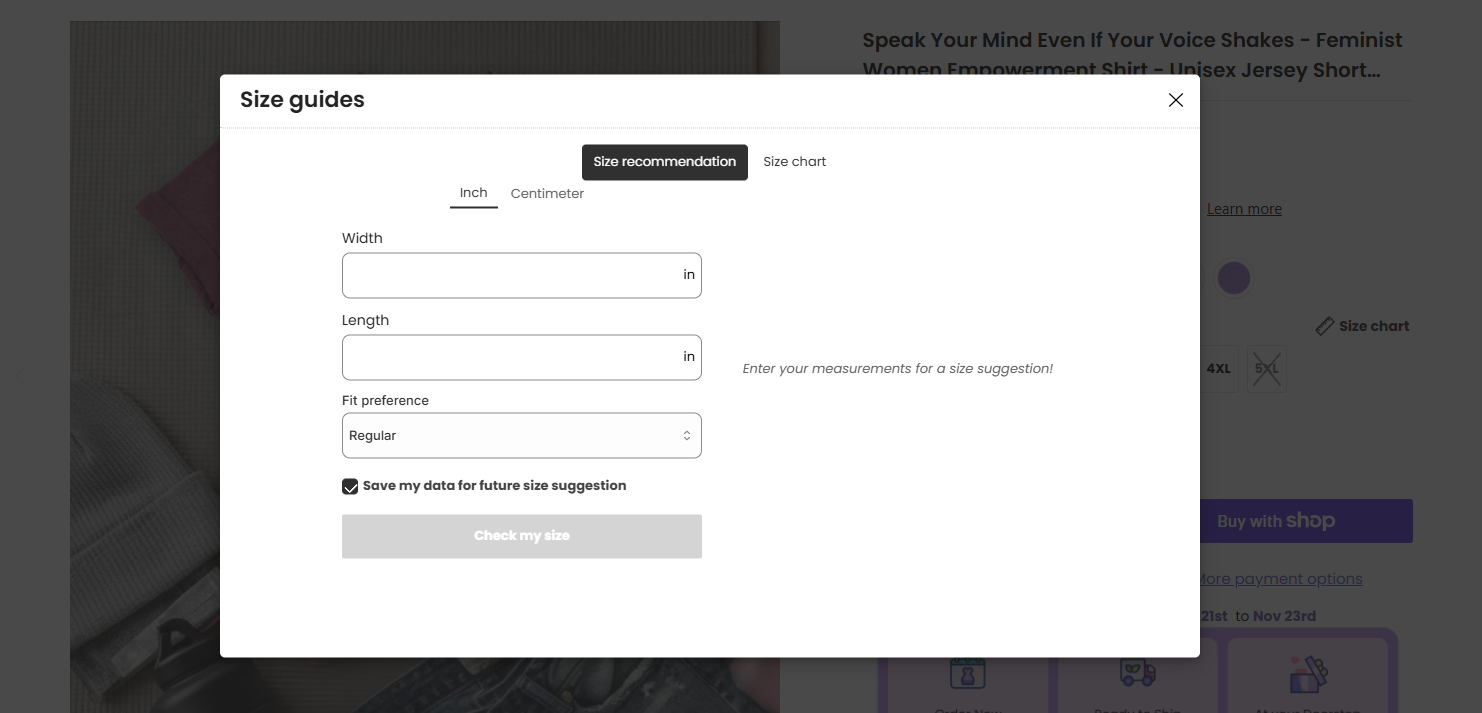
3. Size recommendation on the product page
Loveable turned on Size Recommendation. Shoppers enter a couple of measurements and get a suggested size immediately, without leaving the product page. It made the biggest difference for first-time buyers who had never bought apparel from the store before.
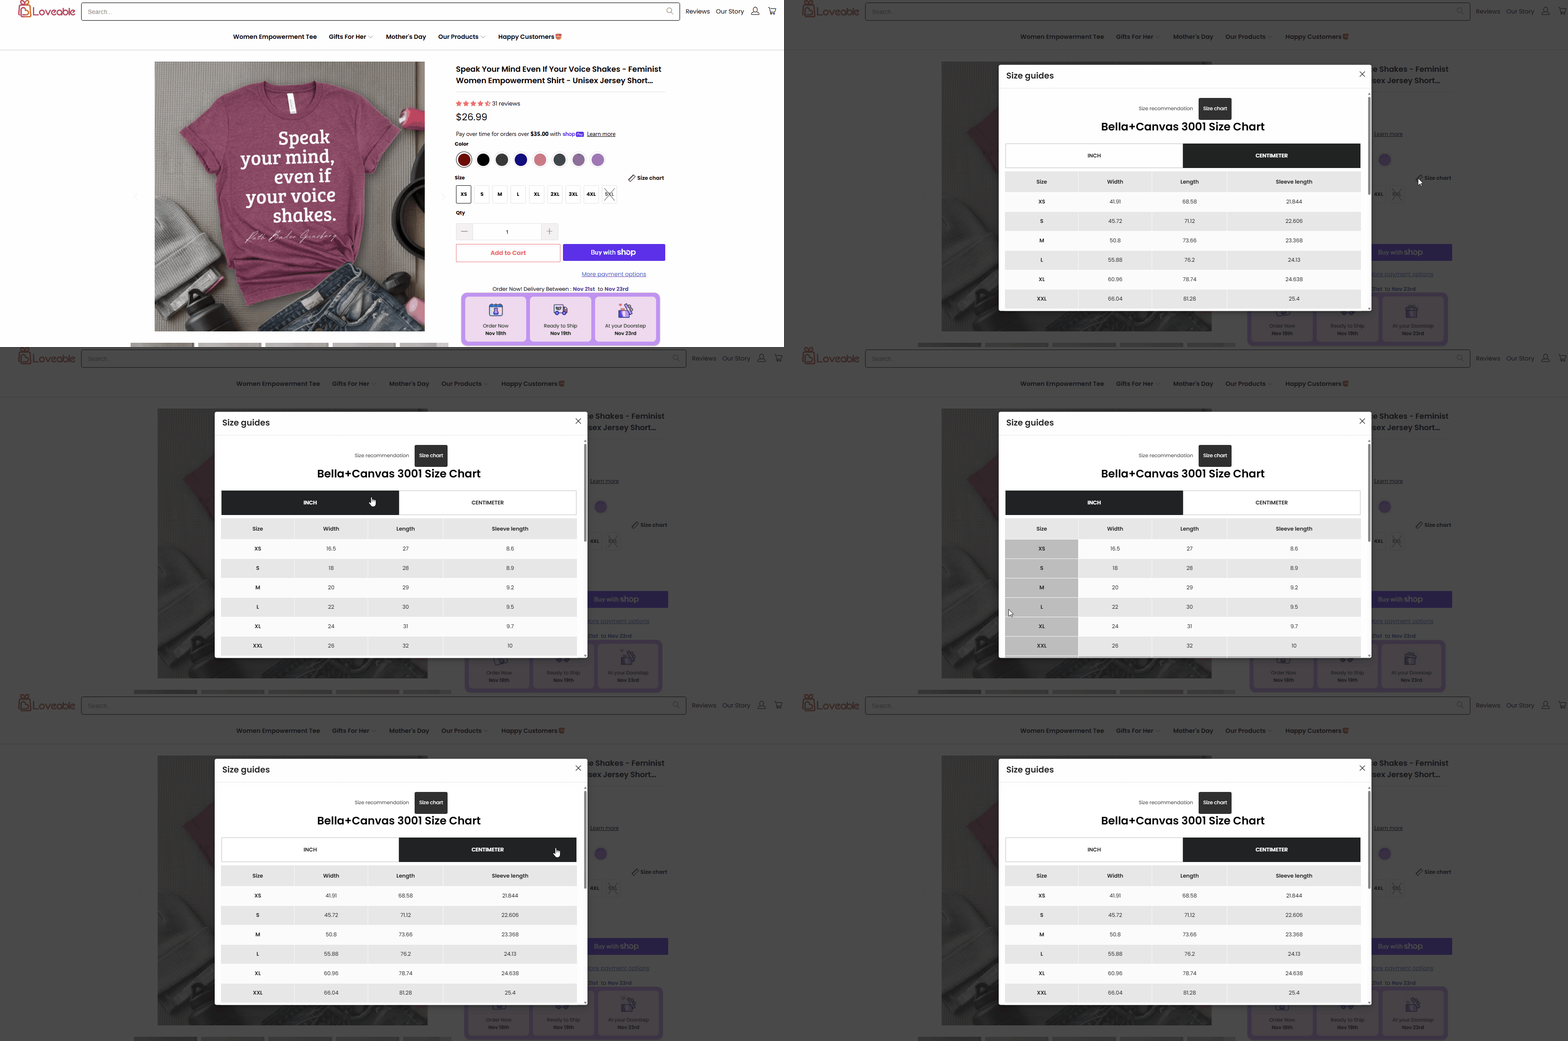
4. Automatic cm/inch conversion
Loveable ships worldwide. Converting between inches and centimeters by hand was error-prone and confusing for international shoppers. The app now converts units automatically, so every customer reads measurements in the system they already use.
5. Chart assignment by product, collection, or tag
Instead of attaching charts one product at a time, Loveable assigns them to individual products, whole collections, or product tags. New SKUs inherit the right chart automatically — which matters when the catalog runs to thousands of customizable items.
6. Size reminder for returning customers
Size Reminder lets a returning shopper see the size they bought last time. It is a small UX detail, but it removes a repeat decision and cuts down wrong-size reorders.
The results after three months
Loveable tracked the same metrics before and after the rollout.
| Metric | Before | After 3 months | Change |
|---|---|---|---|
| Conversion rate | 2.1% | 2.7% | +28.5% |
| Return rate (apparel) | 7.2% | 5.9% | −18% |
| Product page bounce rate | 54% | 41% | −13 pts |
| Size-related support tickets | 112 / month | 61 / month | −45% |
| Customer satisfaction (post-order survey) | 86% | 93% | +7 pts |
Three things stand out. Shoppers spent less time doubting and more time buying. Fewer returns meant lower operational cost per order. And the support team stopped spending its week on the same question.
What the shopper actually sees
On a Loveable product page, the flow is short:
- The shopper opens a product page and clicks the Size Chart button.
- A branded pop-up opens with the measurements and a visual guide.
- They enter their measurements and get a recommended size.
- Size Reminder stores it for the next visit.

FAQs
How long did it take Loveable to set up MP Size Chart & Size Guide?
Just a few minutes. The drag-and-drop chart builder and flexible assignment made onboarding quick and effortless.
Can MP Size Chart work for stores with multiple product types?
Yes. Loveable uses different charts for T-shirts, hoodies, and shoes — all managed from one dashboard.
Is it compatible with all Shopify themes?
Yes. MP Size Chart & Size Guide integrates with both Online Store 2.0 and vintage Shopify themes.
Does the app support international customers?
Yes. Automatic unit conversion and multilingual options let shoppers see measurements in the system they use.
Can I test it before committing?
Yes. There is a free plan covering the core features, so you can try it before choosing a paid plan.
What Loveable would tell another merchant
“The size recommendation feature was a game-changer. It gave our customers instant clarity — and fewer 'What size should I get?' emails for our team.”
Ready to switch? We'll migrate your existing size charts.
Already using another size chart app? Contact our team and we'll move your eligible charts into MP Size Chart & Size Guide — free, in as little as 10 minutes.
More merchant stories
View all case studies

Give Your Shoppers the Same Sizing Clarity
Build your first size chart in minutes, turn on size recommendations, and start measuring the difference on your own product pages.
No credit card required · Free plan available · Free migration from your current size chart app