Quote Analytics
Quote Analytics
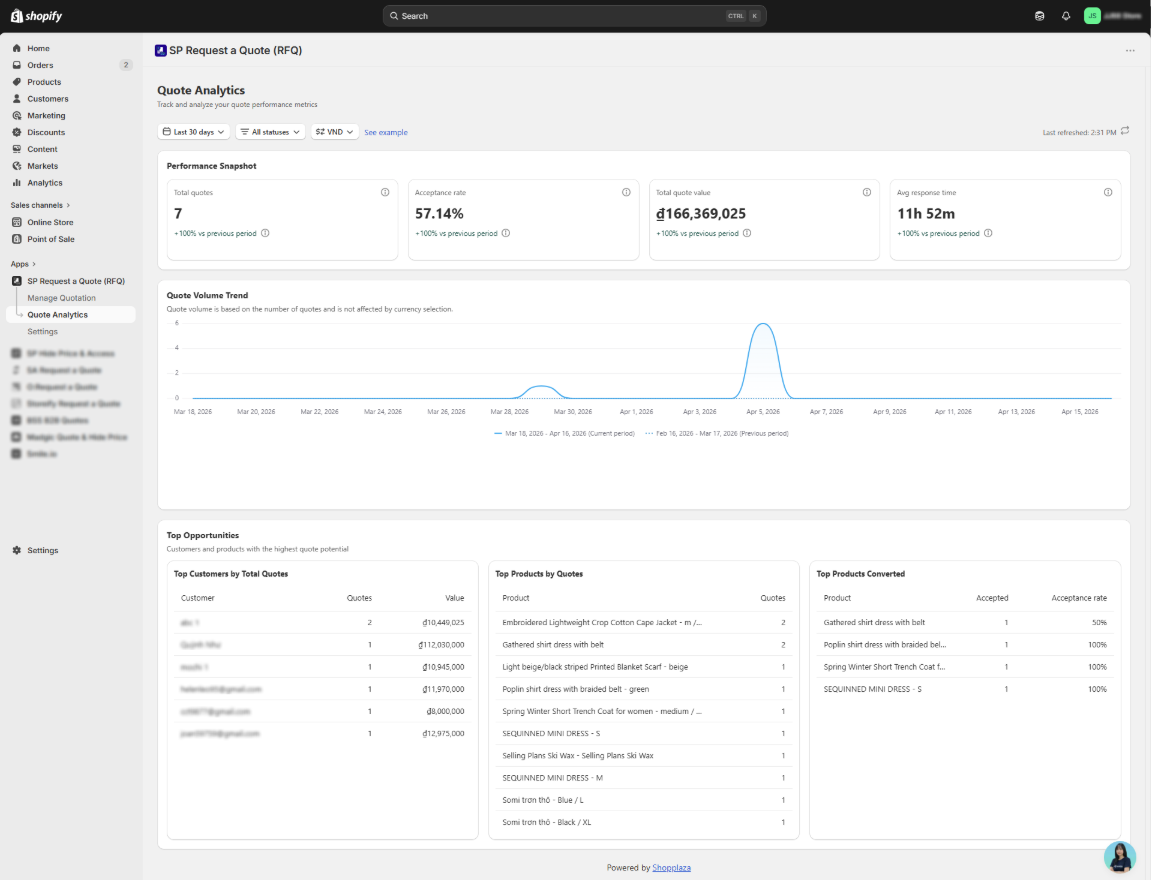
The Quote Analytics dashboard helps you track quote performance and understand how your B2B sales are progressing over time.
At the top of the screen, you can use the filters to adjust what data is displayed:
- Date range - default is Last 30 days
- Quote status - filter by All statuses or a specific status
- Currency - select the currency for displayed values
Stats show a vs previous period comparison for the same date range length.
Block 1 - Performance Snapshot
Four key metrics summarizing your quote activity for the selected period:
- Total quotes - total number of quotes created
- Acceptance rate - percentage of quotes accepted by customers
- Total quote value - combined value of all quotes
- Avg response time - average time from quote request to merchant response
Each metric shows a +/- % change compared to the previous period.
Block 2 - Quote Volume Trend
This chart shows how your quote volume changes over time.
- Compare current period vs. previous period side by side
- Identify trends, spikes, or seasonal patterns
Note: Volume is based on number of quotes, not affected by currency selection.
Block 3 - Top Opportunities
Three tables highlighting your highest-potential customers and products:
- Top Customers by Total Quotes - customers ranked by number of quotes and total value
- Top Products by Quotes - most frequently quoted products
- Top Products Converted - products with the highest accepted quotes and acceptance rate
Note: Advanced analytics will be available in a future update.