How to use the Analytics feature
The Analytics dashboard in the Instagram Feed app helps you understand how your shoppable Instagram content contributes to your store’s performance. By tracking product engagement, conversions, and revenue, you can make smarter decisions to boost sales and optimize content strategy.
This guide will walk you through the available metrics and how to interpret them.
Note: Merchants need to grant permission to access all metrics. We ensure the security and privacy of your data — read more in our policy.
What does the Analytics dashboard show?
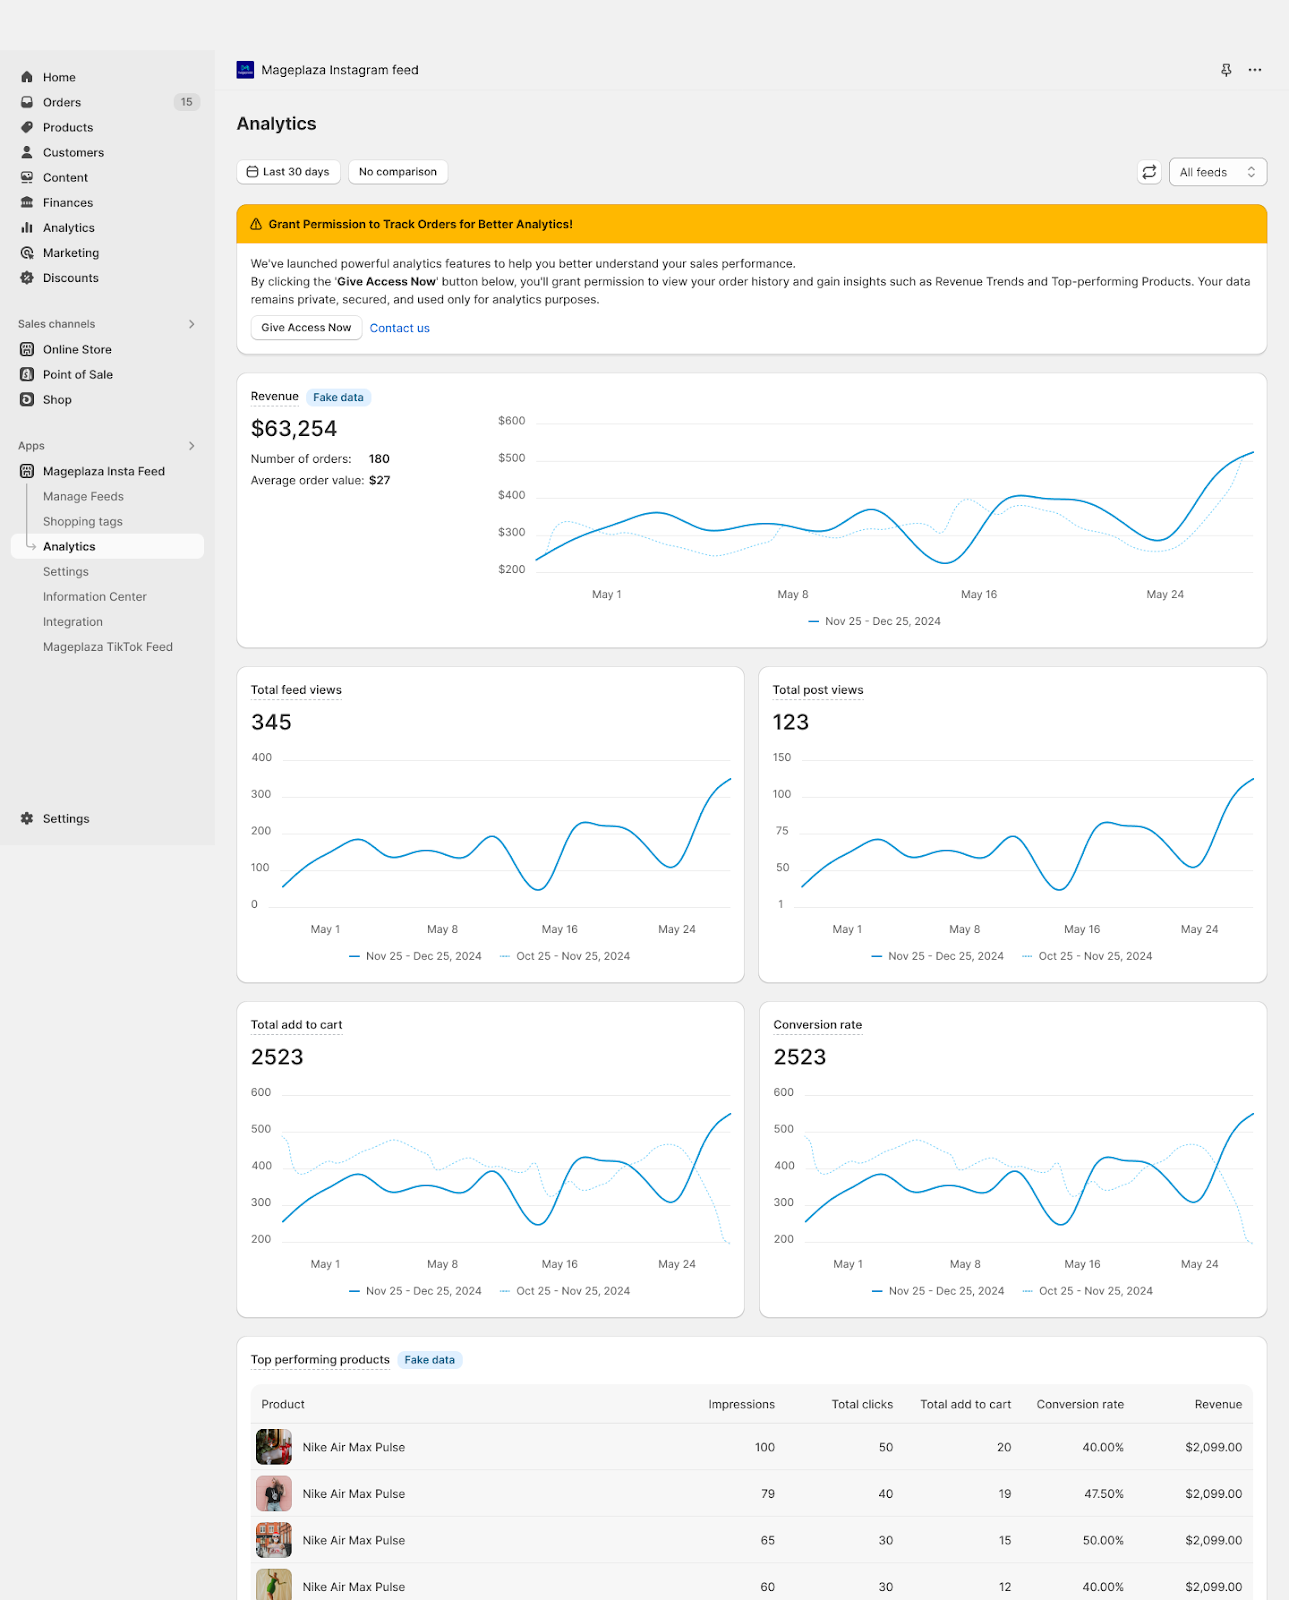
The dashboard offers key insights about how visitors interact with your Instagram Feed and how these interactions impact your sales. It allows you to monitor:
- Revenue & Orders from tagged content
- Average order value
- Add-to-cart & Conversion rate insights
- Feed and post view trends
- Top-performing products
- Historical comparisons to identify trends over time
Filters & Settings
- Last 30 days: Default view for recent activity.
- Custom date range: Click the calendar to select your desired time period.
- Comparison mode:
- Click “No comparison”→ choose a previous period.
- Solid line = current period; Dashed line = past period.
- Refresh Data: Click the refresh icon to get the latest numbers, or reload the app manually.
Revenue
- Revenue: Total revenue generated from product-tagged posts.
- Total orders: Number of purchases tracked from tagged posts.
- Average order value (AOV): Average dollar value per order.
Engagement Metrics
- Feed views: How many times your feed was displayed on your store.
- Post views: How often individual images/videos were viewed.
- Total add to cart: Number of times users clicked “Add to cart” from tagged products.
- Conversion rate: [ total add to cart clicks / total post views ] * 100%.
Top Performing Products Table
Your 5 best-performing products in the feed based on user interaction and conversions.
Metrics per product include:
- Impressions: How many times the product was shown.
- Total clicks: How many users clicked on the product.
- Add to cart: Number of add-to-cart actions.
- Conversion rate: How effectively each product converts.
- Total orders: Completed purchases.